Difference between revisions of "G.I.S.S. Statistics - G-Stats"
| Line 36: | Line 36: | ||
[[Image:24hstats.png]] | [[Image:24hstats.png]] | ||
| + | |||
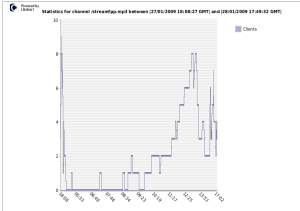
| + | [[Image:24hstats-chan.png]] | ||
* Daily count statistics ( global or per channel ) : | * Daily count statistics ( global or per channel ) : | ||
Revision as of 18:32, 28 January 2009
Context And Goals
This task is intended to provide statistics to G.I.S.S. ( G-Stats ), some tools to visualize the activity of each channel.
Due to the fact that G.I.S.S. relies on more than one icecast server, all data should be gathered in a central database and all the statistics should be produced from there.
The statistics should be available in forms of charts showing the traffic on each channel and able to produce comparative diagrams over various periods of time.
Starting Point
The statistics are already collected in a database, which is used for the map and also in the simple real-time list of channels available here : [Instant Statistics].
Work Achieved
The processes of updating the map and of collecting statistics are using the same database, so some optimization have been introduced for that these two processes run in parallel with a minimum update time.
The update time of map and statistics have been reduced to 3 to 5 minutes depending on the activity.
We chose to use [libchart], a simple php library for drawing chart that fits our needs ( rapidity and basic charts functionalities ).
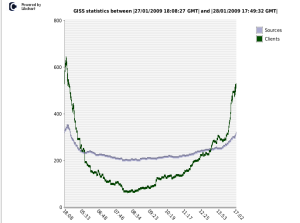
A graph of instant statistics has been made, it reflects the same contents as the map : [Instant Graph of Traffic].
Daily statistics are also available here : [Daily Statistics].
GStats 1.0 published ( 28/01/2009 )
The statistics has been completed and they include the following graphs :
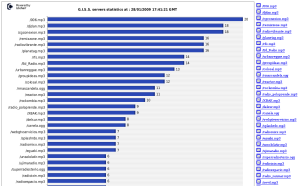
- Instant Statistics ( graph of instant activity with a link to listen/see every channel ):

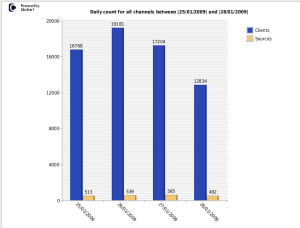
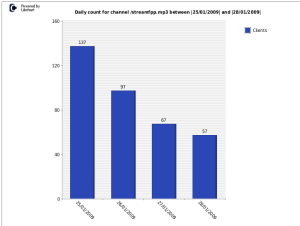
- Last 24 hours statistics ( global or per channel ):


- Daily count statistics ( global or per channel ) :